
Clean, transform, and load data in Power BI
Consider
the scenario where you have imported data into Power BI from several different
sources and, when you examine the data, it is not prepared for analysis. What
could make the data unprepared for analysis?
When
examining the data, you discover several issues, including:
·
A column called Employment status only contains numerals.
·
Several columns
contain errors.
·
Some columns contain
null values.
·
The customer ID in
some columns appears as if it was duplicated repeatedly.
·
A single address
column has combined street address, city, state, and zip code.
You
start working with the data, but every time you create visuals on reports, you
get bad data, incorrect results, and simple reports about sales totals are
wrong.
Dirty
data can be overwhelming and, though you might feel frustrated, you decide to
get to work and figure out how to make this data model as pristine as possible.
Fortunately,
Power BI and Power Query offer you a powerful environment to clean and prepare
the data. Clean data has the following advantages:
·
Measures and columns
produce more accurate results when they perform aggregations and calculations.
·
Tables are organized,
where users can find the data in an intuitive manner.
·
Duplicates are
removed, making data navigation simpler. It will also produce columns that can
be used in slicers and filters.
·
A complicated column
can be split into two, simpler columns. Multiple columns can be combined into
one column for readability.
·
Codes and integers can
be replaced with human readable values.
In
this module, you will learn how to:
·
Resolve
inconsistencies, unexpected or null values, and data quality issues.
·
Apply user-friendly
value replacements.
·
Profile data so you
can learn more about a specific column before using it.
·
Evaluate and transform
column data types.
·
Apply data shape
transformations to table structures.
·
Combine queries.
·
Apply user-friendly
naming conventions to columns and queries.
·
Edit M code in the
Advanced Editor.
Shape the initial data
Power
Query Editor in Power BI Desktop allows you to shape (transform) your
imported data. You can accomplish actions such as renaming columns or tables,
changing text to numbers, removing rows, setting the first row as headers, and
much more. It is important to shape your data to ensure that it meets
your needs and is suitable for use in reports.
You have loaded raw sales data from two sources into a Power
BI model. Some of the data came from a .csv
file that was created manually in Microsoft Excel by the Sales
team. The other data was loaded through a connection
to your organization's Enterprise Resource Planning
(ERP) system. Now, when you look at the data in Power
BI Desktop, you notice that it's in disarray; some data that you
don't need and some data that you do need are in the wrong format.
You
need to use Power Query Editor to clean up and shape this
data before you can start building reports.

Get started with Power Query Editor
To start shaping
your data, open Power Query Editor by selecting the Transform data option
on the Home tab of
Power BI Desktop.

In Power Query
Editor, the data in your selected query displays in the middle
of the screen and, on the left side, the Queries pane lists
the available queries (tables).
When
you work in Power Query Editor, all steps that you take to shape your
data are recorded. Then, each time the query connects to the
data source, it automatically applies your steps, so your data is always shaped
the way that you specified. Power Query Editor only makes changes to
a particular view of your data, so you can feel confident about
changes that are being made to your original data source. You can see a
list of your steps on the right side of the screen, in the Query Settings pane,
along with the query's properties.
The Power
Query Editor ribbon contains many buttons you can use to
select, view, and shape your data.
Note
In
Power Query
Editor, the right-click context menus and Transform tab in
the ribbon provide many of the same options.
Identify
column headers and names
The
first step in shaping your initial
data is to identify the column headers and names within
the data and then evaluate where they are located to ensure that they
are in the right place.
In
the following screenshot, the source data in the csv file for SalesTarget
(sample not provided) had a target categorized by products and a
subcategory split by months, both of which are organized into columns.

However, you
notice that the data did not import as expected.

Consequently, the
data is difficult to read. A problem has occurred with the data in its
current state because column headers are in different rows (marked in
red), and several
columns have undescriptive names, such as Column1, Column2, and
so on.
When you
have identified where the column headers and names are located, you can
make changes to reorganize the data.
Promote headers
When
a table is created in Power BI Desktop,
Power Query Editor assumes that all data belongs in
table rows. However, a data source might have a first row that contains column
names, which is what happened in the previous
SalesTarget example. To correct this inaccuracy, you need to promote
the first table row into column headers.
You
can promote headers in two ways: by selecting the Use First Row as Headers option
on the Home tab or
by selecting the drop-down button next to Column1 and then selecting Use First Row as Headers.

The following image illustrates how the Use First Row as Headers feature impacts the data:

Rename columns
The
next step in shaping your data is to examine
the column headers. You might discover that one or more
columns have the wrong headers, a header has a spelling error,
or the header naming convention is not consistent or
user-friendly.
Refer
to the previous screenshot, which shows the impact of the Use First Row as Headers feature.
Notice that the column that contains the subcategory Name data now has Month as its column
header. This column header is incorrect, so it needs to be
renamed.
You
can rename column headers in two ways. One approach is to
right-click the header, select Rename,
edit the name, and then press Enter. Alternatively,
you can double-click the column header and overwrite the name with
the correct name.
You
can also work around this issue by removing
(skipping) the first two rows and then renaming the
columns to the correct name.
Remove
top rows
When
shaping your data, you might need to remove some of the top rows, for
example, if they are blank or if they contain data that you do not
need in your reports.
Continuing
with the SalesTarget example, notice that the
first row is blank (it has no data) and the second row has
data that is no longer required.

To
remove these excess rows, select Remove Rows > Remove Top Rows on
the Home tab.

Remove
columns
A
key step in the data shaping process is to remove unnecessary
columns. It is much better to remove columns as early as possible. One way
to remove columns would be to limit the column when you get data from data
source. For instance, if you are extracting data from a relational database by
using SQL, you would want to limit the column that you extract by using a
column list in the SELECT statement.
Removing
columns at an early stage in the process rather than later is best, especially
when you have established relationships between your tables. Removing unnecessary
columns will help you to focus on the data that you need and help improve the
overall performance of your Power BI Desktop datasets and reports.
Examine
each column and ask yourself if you really need the data that it contains. If
you don't plan on using that data in a report, the column adds
no value to your data model. Therefore, the column should be
removed. You can always add the column later, if your requirements
change over time.
You
can remove columns in two ways. The first method is to select
the columns that you want to remove and then, on the Home tab, select Remove Columns.

Alternatively,
you can select the columns that you want to keep and
then, on the Home tab,
select Remove
Columns > Remove
Other Columns.

Unpivot columns
Unpivoting
is a useful feature of Power BI. You can use this feature with data from any
data source, but you would most often use it when importing data from Excel.
The following example shows a sample Excel document with sales data.

Though
the data might initially make sense, it would be difficult to create a total of
all sales combined from 2018 and 2019. Your goal would then be to use this data
in Power BI with three columns: Month, Year, and SalesAmount.
When
you import the data into Power Query, it will look like the following image.

Next,
rename the first column to Month.
This column was mislabeled because that header in Excel was labeling the 2018
and 2019 columns. Highlight the 2018 and 2019 columns, select the Transform tab
in Power Query, and then select Unpivot.

You
can rename the Attribute column
to Year and
the Value column
to SalesAmount.
Unpivoting
streamlines the process of creating DAX measures on the data later. By
completing this process, you have now created a simpler way of slicing the data
with the Year and Month columns.
Pivot columns
If
the data that you are shaping is flat (in other words,
it has lot of detail but is not organized or grouped in any
way), the lack of structure can complicate your ability to identify patterns in
the data.
You
can use the Pivot
Column feature to convert your flat data into
a table that contains an aggregate value for each unique value in a
column. For example, you might want to use this feature to summarize
data by using different math functions such as Count, Minimum, Maximum, Median, Average, or Sum.
In the SalesTarget example, you
can pivot the columns to get the quantity of product
subcategories in each product category.
On
the Transform tab,
select Transform > Pivot
Columns.

On
the Pivot Column window
that displays, select a column from the Values Column list, such as Subcategory name. Expand the
advanced options and select an option from the Aggregate Value Function list,
such as Count
(All), and then select OK.

The following image illustrates how the Pivot Column feature changes the way that the data is organized.

Power Query Editor records all steps that you take to shape your data, and the list of steps are shown in the Query Settings pane. If you have made all the required changes, select Close & Apply to close Power Query Editor and apply your changes to your data model. However, before you select Close & Apply, you can take further steps to clean up and transform your data in Power Query Editor. These additional steps are covered later in this module.
Simplify the data structure
When you
import data from multiple sources into Power BI
Desktop, the data retains its predefined table and
column names. You might want to change some of these names
so that they are in a consistent format, easier to work
with, and more meaningful to a user. You can use Power
Query Editor in Power BI Desktop to make these name changes and simplify your
data structure.
To
continue with the previous scenario where you shaped the
initial data in your model, you need to take further action to
simplify the structure of the sales data and get it ready
for developing reports for the Sales team. You have already
renamed the columns, but now you need to examine the names of the queries
(tables) to determine if any improvements can be made. You also need
to review the contents of the columns and
replace any values that require correction.
Rename a
query
It's
good practice to change uncommon or unhelpful query names to names that are
more obvious or that the user is more familiar
with. For instance, if you import a product fact table into
Power BI Desktop and the query name displays as FactProductTable, you
might want to change it to a more user-friendly name, such as Products. Similarly, if
you import a view, the view might have a name that contains a prefix of v, such as vProduct. People might
find this name unclear and confusing, so you might want to remove the
prefix.
In
this example, you have examined the name of the TargetSales query and realize
that this name is unhelpful because you'll have a query with this name
for every year. To avoid confusion, you want to add the year to the
query name.
In Power
Query Editor, in the Queries pane to
the left of your data, select the query that you want to rename.
Right-click the query and select Rename. Edit the current name or
type a new name, and then press Enter.

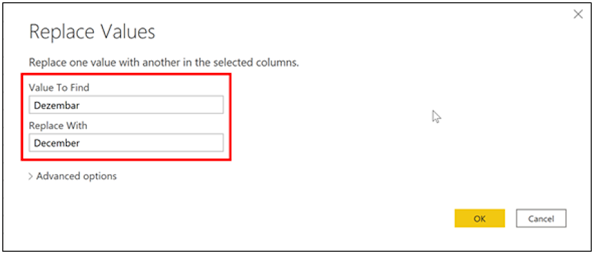
Replace
values
You
can use the Replace
Values feature in Power Query Editor to replace
any value with another value in a selected column.
In
this example, you notice that, in the Attribute column, the
month December is misspelled. You need to correct this spelling
mistake. Select the column that contains the value that you want to
replace (Attribute in
this case), and then select Replace
Values on the Transform tab.

In the Value to Find box, enter the name of the value that you want to replace, and then in the Replace With box, enter the correct value name and then select OK. In Power Query, you can't select one cell and change one value, like you might have done in Excel.
You
can review the list of steps that you took to restructure and correct your
data in the Query
Settings pane. When you have completed all
steps that you want to take, you can select Close & Apply to
close Power Query Editor and apply your changes to your data
model. However, you can take further action to clean and
transform your data.
Replace null
values
Occasionally,
you might find that your data sources contain null values.
For example, a freight amount on
a sales order might have a null value if it's
synonymous with zero. If the value stays null, the averages will not
calculate correctly. One solution would be to change the nulls
to zero, which will produce the more accurate freight average. In this
instance, using the same steps that you followed previously will help you
replace the null values with zero.

Remove duplicates
You
can also remove duplicates from columns to only keep unique names in a selected
column by using the Remove
Duplicates feature in Power Query.
In
this example, notice that the Category
Name column contains duplicates for each category. As a
result, you want to create a table with unique categories and use it in your
data model. You can achieve this action by selecting a column, right-clicking
on the header of the column, and then selecting the Remove Duplicates option.
You
might consider copying the table before removing the duplicates. The Copy option is
at the top of the context menu, as shown in the following screenshot. Copying
the table before removing duplicates will give you a comparison of the tables
and will let you use both tables, if needed.

Best
practices for naming tables, columns, and values
Naming
conventions for tables, columns, and values have no fixed rules; however, we
recommend that you use the language and abbreviations that are commonly used
within your organization and that everyone agrees on and considers them as
common terminology.
A
best practice is to give your tables, columns, and measures descriptive
business terms and replace underscores ("_") with spaces.
Be consistent with abbreviations, prefaces, and words like
"number" and "ID." Excessively short abbreviations can
cause confusion if they are not commonly used within the organization.
Also,
by removing prefixes or suffixes that you might use in table names and instead
naming them in a simple format, you will help avoid confusion.
When
replacing values, try to imagine how those values will appear on the report.
Values that are too long might be difficult to read and fit on a visual. Values
that are too short might be difficult to interpret. Avoiding acronyms in values
is also a good idea, provided that the text will fit on the visual.
Next unit:
Evaluate and change column data types
Simplify the data structure
When you
import data from multiple sources into Power BI
Desktop, the data retains its predefined table and
column names. You might want to change some of these
names so that they are in a consistent format, easier to work
with, and more meaningful to a user. You can use Power
Query Editor in Power BI Desktop to make these name changes and simplify your
data structure.
To
continue with the previous scenario where you shaped the
initial data in your model, you need to take further action to
simplify the structure of the sales data and get it ready
for developing reports for the Sales team. You have already
renamed the columns, but now you need to examine the names of the queries
(tables) to determine if any improvements can be made. You also need
to review the contents of the columns and
replace any values that require correction.
Rename a
query
It's
good practice to change uncommon or unhelpful query names to names that are
more obvious or that the user is more familiar with. For instance, if
you import a product fact table into Power BI Desktop and the query name
displays as FactProductTable,
you might want to change it to a more user-friendly name, such as Products. Similarly, if
you import a view, the view might have a name that contains a prefix of v, such as vProduct. People might
find this name unclear and confusing, so you might want to remove the
prefix.
In
this example, you have examined the name of
the TargetSales query and realize that this name is
unhelpful because you'll have a query with this name for every
year. To avoid confusion, you want to add the year to the query
name.
In Power
Query Editor, in the Queries pane to
the left of your data, select the query that you want to rename.
Right-click the query and select Rename. Edit the current name or
type a new name, and then press Enter.

Replace
values
You
can use the Replace
Values feature in Power Query Editor to replace
any value with another value in a selected column.
In
this example, you notice that, in the Attribute column, the
month December is misspelled. You need to correct this spelling
mistake. Select the column that contains the value that you want to
replace (Attribute in
this case), and then select Replace
Values on the Transform tab.

In
the Value to
Find box, enter the name of the value that
you want to replace, and then in the Replace With box, enter the
correct value name and then select OK. In Power
Query, you can't select one cell and change one value, like you might have done
in Excel.

You
can review the list of steps that you took to restructure and correct your
data in the Query
Settings pane. When you have completed all
steps that you want to take, you can select Close & Apply to
close Power Query Editor and apply your changes to your data
model. However, you can take further action to clean and
transform your data.
Replace null
values
Occasionally,
you might find that your data sources contain null values.
For example, a freight amount on
a sales order might have a null value if it's
synonymous with zero. If the value stays null, the averages will not
calculate correctly. One solution would be to change the nulls
to zero, which will produce the more accurate freight average. In this
instance, using the same steps that you followed previously will help you
replace the null values with zero.

Remove
duplicates
You
can also remove duplicates from columns to only keep unique names in a selected
column by using the Remove
Duplicates feature in Power Query.
In
this example, notice that the Category
Name column contains duplicates for each category. As a
result, you want to create a table with unique categories and use it in your
data model. You can achieve this action by selecting a column, right-clicking
on the header of the column, and then selecting the Remove Duplicates option.
You
might consider copying the table before removing the duplicates. The Copy option is
at the top of the context menu, as shown in the following screenshot. Copying
the table before removing duplicates will give you a comparison of the tables
and will let you use both tables, if needed.

Best
practices for naming tables, columns, and values
Naming
conventions for tables, columns, and values have no fixed rules; however, we
recommend that you use the language and abbreviations that are commonly used
within your organization and that everyone agrees on and considers them as
common terminology.
A
best practice is to give your tables, columns, and measures descriptive
business terms and replace underscores ("_") with spaces.
Be consistent with abbreviations, prefaces, and words like
"number" and "ID." Excessively short abbreviations can
cause confusion if they are not commonly used within the organization.
Also,
by removing prefixes or suffixes that you might use in table names and instead
naming them in a simple format, you will help avoid confusion.
When
replacing values, try to imagine how those values will appear on the report.
Values that are too long might be difficult to read and fit on a visual. Values
that are too short might be difficult to interpret. Avoiding acronyms in values
is also a good idea, provided that the text will fit on the visual.
Evaluate and change column data types
When
you import a table from any data source, Power BI Desktop automatically starts
scanning the first 1,000 rows (default setting) and tries to detect the type of
data in the columns. Some situations might occur where Power BI Desktop does
not detect the correct data type. Where incorrect data types occur, you will
experience performance issues.
You
have a higher chance of getting data type errors when you are dealing with flat
files, such as comma-separated values (.CSV) files and Excel workbooks (.XLSX),
because data was entered manually into the worksheets and mistakes were made.
Conversely, in databases, the data types are predefined when tables or views
are created.
A
best practice is to evaluate the column data types in Power Query Editor before
you load the data into a Power BI data model. If you determine that a data type
is incorrect, you can change it. You might also want to apply a format to the
values in a column and change the summarization default for a column.
To
continue with the scenario where you are cleaning and transforming sales data
in preparation for reporting, you now need to evaluate the columns to ensure
that they have the correct data type. You need to correct any errors that you
identify.
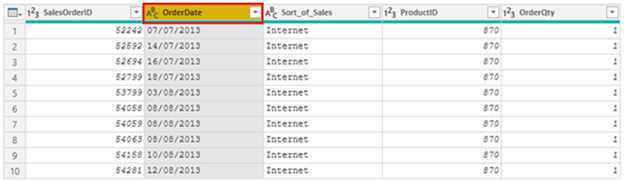
You
evaluate the OrderDate column.
As expected, it contains numeric data, but Power BI Desktop has incorrectly set
the column data type to Text. To report on this column, you need to change the
data type of this column from Text to Date.
Implications
of incorrect data types
The
following information provides insight into problems that can arise when Power
BI does not detect the correct data type.
Incorrect
data types will prevent you from creating certain calculations, deriving
hierarchies, or creating proper relationships with other tables. For example,
if you try to calculate the Quantity of Orders YTD, you will get the following
error stating that the OrderDate column
data type is not Date, which is required in time-based calculations.
Quantity
of Orders YTD = TOTALYTD(SUM('Sales'[OrderQty]), 'Sales'[OrderDate])

Another
issue with having an incorrect data type applied on a date field is the
inability to create a date hierarchy, which would allow you to analyze your
data on a yearly, monthly, or weekly basis. The following screenshot shows that
the SalesDate field is not recognized as type Date and will only be presented as
a list of dates in the Table visual. However, it is a best practice to use a
date table and turn off the auto date/time to get rid of the auto-generated
hierarchy. For more information about this process, see Auto-generated data type documentation.

Change the column data type
You
can change the data type of a column in two places: in Power Query Editor and
in the Power BI Desktop Report view by using the column tools. It is best to
change the data type in the Power Query Editor before you load the data.
Change
the column data type in Power Query Editor
In
Power Query Editor, you can change the column data type in two ways. One way is
to select the column that has the issue, select Data Type in
the Transform tab,
and then select the correct data type from the list.

Another method is to select the data type icon next to the column header and then select the correct data type from the list.

As
with any other changes that you make in Power Query Editor, the change that you
make to the column data type is saved as a programmed step. This step is
called Changed
Type and it will be iterated every time the data is
refreshed.
After
you have completed all steps to clean and transform your data, select Close & Apply to
close Power Query Editor and apply your changes to your data model. At this
stage, your data should be in great shape for analysis and reporting.
Combine multiple tables into a single table
The
ability to combine queries is powerful because it allows you to append or merge
different tables or queries together. You can combine tables into a single
table in the following circumstances:
·
Too many tables exist, making it difficult to navigate an
overly-complicated data model.
·
Several tables have a similar role.
·
A table has only a column or two that can fit into a different
table.
·
You want to use several columns from different tables in a
custom column.
You
can combine the tables in two different ways: merging and appending.
Assume
that you are developing Power BI reports for the Sales and
HR teams. They have asked you to create a
contact information report that contains the contact information
and location of every employee, supplier, and customer. The data
is in the HR.Employees, Production.Suppliers, and the Sales.Customers tables,
as shown in the following image.

However, this
data comes from multiple tables, so the dilemma is determining how you can
merge the data in these multiple tables and create one source-of-truth
table to create a report from. The inherent functionality of Power BI allows
you to combine and merge queries into a single table.
Append
queries
When
you append queries, you will be adding rows of data to another table or
query. For example, you could have two tables, one with 300 rows and
another with 100 rows, and when you append queries, you will end up with 400
rows. When you merge queries, you will be adding columns from one
table (or query) into another. To merge two tables, you must have
a column that is the key between the two tables.
For
the previously mentioned scenario, you will append the
HR.Employees table with the
Production.Suppliers and Sales.Customers tables so that you have
one master list of contact information. Because you want to create
one table that has all contact information for employees, suppliers,
and customers, when you combine the queries, the pertinent
columns that you require in your combined table must be named the same in
your original data tables to see one consolidated view.
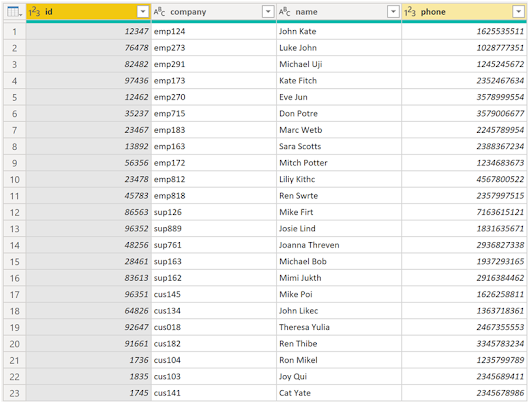
Before
you begin combining queries, you can remove extraneous columns that you don't
need for this task from your tables. To complete this task, format each table
to have only four columns with your pertinent information, and rename them so
they all have the same column headers: ID, company, name, and
phone. The following images are snippets of the reformatted
Sales.Customers, Production.Suppliers, and HR.Employees tables.

After
you have finished reformatting, you can combine the queries. On the Home tab on
the Power Query Editor ribbon, select the drop-down list for Append Queries. You
can select Append Queries as
New, which means that the output of appending will result
in a new query or table, or you can select Append Queries, which will add
the rows from an existing table into another.
Your
next task is to create a new master table, so you need to select Append Queries as New.
This selection will bring you to a window where you can add
the tables that you want to append from Available Tables to Tables to Append,
as shown in the following image.

After
you have added the tables that you want to append, select OK. You will be
routed to a new query that contains all rows from all three of your
tables, as shown in the following image.
You
have now succeeded in creating a master table that contains the information for
the employees, suppliers, and customers. You can exit Power Query Editor and
build any report elements surrounding this master table.
However,
if you wanted to merge tables instead of appending the data from one table
to another, the process would be different.
Merge
queries
When
you merge queries, you are combining the data from multiple tables into one
based on a column that is common between the tables. This process is similar
to the JOIN clause in SQL. Consider a scenario where the Sales team now
wants you to consolidate orders and their corresponding details (which are
currently in two tables) into a single table. You can accomplish this task by
merging the two tables, Orders and OrderDetails, as shown in the following
image. The column that is shared between these two tables is OrderID.

Go
to Home on
the Power Query Editor ribbon and select the Merge Queries drop-down
menu, where you can select Merge
Queries as New. This selection will open a new
window, where you can choose the tables that you want to
merge from the drop-down list, and then select the column that is matching
between the tables, which in this case is ordered.

You
can also choose how to join the two tables together, a process that
is also similar to JOIN statements in SQL. These join options
include:
·
Left Outer -
Displays all rows from the first table and only the matching rows
from the second.
·
Full Outer - Displays all
rows from both tables.
·
Inner -
Displays the matched rows between the two tables.
For
this scenario, you will choose to use a Left Outer join. Select OK, which will
route you to a new window where you can view your merged query.

Now, you can merge two queries or tables in different ways so that you can view your data in the most appropriate way for your business requirements.
Profile data in Power BI
Profiling
data is about studying the nuances of the data: determining anomalies,
examining and developing the underlying data structures, and querying
data statistics such as row counts, value distributions, minimum and
maximum values, averages, and so on. This concept is important because it
allows you to shape and organize the data so that interacting with the
data and identifying the distribution of the data is uncomplicated,
therefore helping to make your task of working with the data on the front end
to develop report elements near effortless.
Assume
that you are developing reports for the Sales team at your
organization. You are uncertain how the data is structured
and contained within the tables, so you want to profile the
data behind the scenes before you begin developing the
visuals. Power BI has inherent functionality that makes these
tasks user-friendly and straightforward.
Examine data
structures
Before
you begin examining the data in Power Query Editor, you should first
learn about the underlying data structures that data is organized in. You
can view the current data model under the Model tab on Power BI Desktop.

On
the Model tab,
you can edit specific column and table properties by selecting a table or
columns, and you can transform the data by using the Transform Data button,
which takes you to Power Query Editor. Additionally, you can manage, create,
edit, and delete relationships between different tables by using Manage Relationships,
which is located on the ribbon.
Find data
anomalies and data statistics
After
you have created a connection to a data source and have selected Transform Data, you
are brought to Power Query Editor, where you can determine if anomalies exist
within your data. Data anomalies are outliers within your data.
Determining what those anomalies are can help you identify what the normal
distribution of your data looks like and whether specific data points exist
that you need to investigate further. Power Query Editor determines data
anomalies by using the Column
Distribution feature.
Select View on the
ribbon, and under Data
Preview, you can choose from a few options. To understand
data anomalies and statistics, select the Column Distribution, Column Quality,
and Column
Profile options. The following figure shows the
statistics that appear.
Column quality and Column distribution are
shown in the graphs above the columns of data. Column quality shows
you the percentages of data that is valid, in error, and empty. In an
ideal situation, you want 100 percent of the data to be valid.

Note
By
default, Power Query examines the first 1000 rows of your data set. To change
this, select the profiling status in the status bar and select Column profiling based on entire
data set. ]
Column distribution shows
you the distribution of the data within the column and the counts of
distinct and unique values, both of which can tell you details about the
data counts. Distinct values are all values in a column,
including duplicates and null values, while unique values do not include
duplicates or nulls. Therefore, distinct in this table tells you
the total count of how many values are present, while unique tells
you how many of those values only appear once.
Column profile gives you a more
in-depth look into the statistics within the columns for the first 1,000 rows
of data. This column provides several different values,
including the count of rows, which is important when verifying
whether the importing of your data was successful. For example, if
your original database had 100 rows, you could use this row count to
verify that 100 rows were, in fact, imported correctly. Additionally, this row
count will show how many rows that Power BI has deemed as being outliers, empty
rows and strings, and the min and max, which will tell you the smallest
and largest value in a column, respectively. This distinction is
particularly important in the case of numeric data because it will immediately
notify you if you have a maximum value that is beyond what your business
identifies as a "maximum." This value calls to your attention these
values, which means that you can then focus your efforts when delving
deeper into the data. In the case where data was in the text column, as
seen in the previous image, the minimum value is the first value
and the maximum value is the last value when in alphabetical order.
Additionally,
the Value
distribution graph tells you the counts for each
distinct value in that specific column. When looking at the graph in the
previous image, notice that the value distribution indicates that "Anthony
Grosse" appears the greatest number of times within
the SalesPerson column
and that "Lily Code" appears the least amount of times. This
information is particularly important because it identifies outliers. If a
value appears far more than other values in a column, the Value distribution feature
allows you to pinpoint a place to begin your investigation into
why this is so.
On
a numeric column, Column
Statistics will also include how many zeroes and
null values exist, along with the average value in the column, the
standard deviation of the values in the column, and how many even and odd
values are in the column. These statistics give you an idea of the distribution
of data within the column, and are important because they summarize the
data in the column and serve as a starting point to determine what the outliers
are.
For
example, while looking through invoice data, you notice that the Value distribution graph
shows that a few salespeople in the SalesPerson column
appear the same amount of times within the data. Additionally, you notice the
same situation has occurred in the Profit column
and in a few other tables as well. During your investigation, you discover
that the data you were using was bad data and needed to be refreshed, so you
immediately complete the refresh. Without viewing this graph, you might
not have seen this error so quickly and, for this reason, value
distribution is essential.
After
you have completed your edits in Power Query Editor and are ready to begin
building visuals, return to Home on
the Power Query Editor ribbon. Select Close & Apply, which will return
you to Power BI Desktop and any column edits/transformations will also be
applied.
You
have now determined the elements that make up profiling data in Power BI, which
include loading data in Power BI, interrogating column properties to gain
clarity about and make further edits to the type and format of data in
columns, finding data anomalies, and viewing data statistics in Power
Query Editor. With this knowledge, you can include in your toolkit the
ability to study your data in an efficient and effective manner.
Use Advanced Editor to modify M code
Each
time you shape data in Power Query, you create a step in the Power Query
process. Those steps can be reordered, deleted, and modified where it
makes sense. Each cleaning step that you made was likely created by using
the graphical interface, but Power Query uses the M language behind the
scenes. The combined steps are available to read by using the Power Query
Advanced Editor. The M language is always available to be read and modified
directly. It is not required that you use M code to take advantage of Power
Query. You will rarely need to write M code, but it can still prove useful.
Because each step in Power Query is written in M code, even if the UI created
it for you, you can use those steps to learn M code and customize it to suit
your needs.
After
creating steps to clean data, select the View ribbon of Power Query and
then select Advanced
Editor.

The
following screen should appear.

Each
Power Query step will roughly align with one or two lines of M code. You don't
have to be an expert in M code to be able to read it. You can even experiment
with changing it. For instance, if you need to change the name of a database,
you could do it right in the code and then select Done.
You
might notice that M code is written top-down. Later steps in the process
can refer to previous steps by the variable name to the left of the equal sign.
Be careful about reordering these steps because it could ruin the statement
dependencies. Write to a query formula step by using the in statement.
Generally, the last query step is used as the in final data set result.
Lab - Load data in Power BI Desktop
This unit includes a lab to
complete.
Use
the free resources provided in the lab to complete the exercises in this unit.
You will not be charged.
Sign in to launch the lab
Access
your environment
Before
you start this lab (unless you are continuing from a previous lab),
select Launch
lab above.
You
are automatically logged in to your lab environment as data-ai\student.
You
can now begin your work on this lab.
Tip
To
dock the lab environment so that it fills the window, select the PC icon at the
top and then select Fit
Window to Machine.

Overview
The
estimated time to complete the lab is 45 minutes.
In
this lab, you'll begin to apply transformations to queries. You'll then apply
the queries to load each as a table to the data model.
In
this lab, you learn how to:
·
Apply various transformations
·
Apply queries to load them to the data model
Before
you start this lab, you will need to open the lab environment link above, and
log in to the lab environment. There is no need to provide your own
environment, as an environment has been prepared for this lab.
Load Data
In
this exercise, you'll apply transformations to each of the queries.
Open
the solution file
1.
Double-click the Power BI Desktop icon. (This may take a minute
or two to open.)
2.
Dismiss the splash screen by selecting X to close.
3. From the File tab, select Open report, and then Browse reports.
4.
You will open Sales
Analysis.pbix file, which is found in the D:\DA100\Lab03A\Starter folder.
Configure
the Salesperson query
In
this task, you'll configure the Salesperson query.
1.
To open the Power
Query Editor window, in Power BI Desktop, on the Home
ribbon tab, click Transform
Data.
2.
In the Power Query Editor window,
in the Queries pane,
select the DimEmployee query.
3.
To rename the query, in the Query Settings pane (located
at the right), in the Name box,
replace the text with Salesperson,
and then press Enter.
The query name will determine the model table name. It's
recommended to define concise, yet friendly, names.
4.
In the Queries pane,
verify that the query name has updated.

You'll now filter the query rows to retrieve only employees who
are salespeople.
5.
To locate a specific column, on the Home ribbon
tab, from inside the Manage Columns group,
click the Choose Columns down-arrow,
and then select Go to Column.

Tip
This technique is useful when a query contains many columns.
Usually, you can simply horizontally scroll to locate the column.
6.
In the Go to Column window,
to order the list by column name, click the AZ sort
button, and then select Name.

7.
Select the SalesPersonFlag column,
and then click OK.
8.
To filter the query, in the SalesPersonFlag column header,
click the down-arrow, and then uncheck FALSE.

9.
Click OK.
10.
In the Query Settings pane,
in the Applied Steps list,
notice the addition of the Filtered Rows step.
Each transformation you create results in additional step logic.
It's possible to edit or delete steps. It's also possible to select a step to
preview the query results at that stage of transformation.
11.
To remove columns, on the Home ribbon tab, from inside
the Manage Columns group,
click the Choose Columns icon.
12.
In the Choose Columns window,
to uncheck all columns, uncheck the (Select All Columns) item.
13.
To include columns, check the following six columns:
o EmployeeKey
o EmployeeNationalIDAlternateKey
o FirstName
o LastName
o Title
o EmailAddress
14.
Click OK.
15.
In the Applied Steps list,
notice the addition of another query step.

16.
To create a single name column, first select the FirstName column
header.
17.
While pressing the Ctrl key,
select the LastName column.
18.
Right-click either of the select column headers, and then in the
context menu, select Merge Columns.
Many common transformations can be applied by right-clicking the
column header, and then choosing them from the context menu. However, that all
transformations and more are available in the ribbon.
19.
In the Merge Columns window,
in the Separator dropdown
list, select Space.
20.
In the New Column Name box,
replace the text with Salesperson.

21.
Click OK.
22.
To rename the EmployeeNationalIDAlternateKey column,
double-click the EmployeeNationalIDAlternateKey column
header.
23.
Replace the text with EmployeeID, and then press Enter.
When instructed to rename columns, it's important that you
rename them exactly as described.
24.
Use the previous steps to rename the EmailAddress column
to UPN.
UPN is an acronym for User Principal Name. The values in this
column will be used when you configure row-level security in Lab 05A.
25.
At the bottom-left, in the status bar, verify that the query has
5 columns and 18 rows.
Configure
the SalespersonRegion query
In
this task, you'll configure the SalespersonRegion query.
1.
In the Queries pane,
select the DimEmployeeSalesTerritory query.
2.
In the Query Settings pane,
rename the query to SalespersonRegion.
3.
To remove the last two columns, first select the DimEmployee column
header.
4.
While pressing the Ctrl key,
select the DimSalesTerritory column
header.
5.
Right-click either of the select column headers, and then in the
context menu, select Remove Columns.
6.
In the status bar, verify that the query has 2 columns and 39
rows.
Configure
the Product query
In
this task, you'll configure the Product query.
When
detailed instructions have already been provided in the labs, the lab steps
will now provide more concise instructions. If you need the detailed
instructions, you can refer back to other tasks.
1.
Select the DimProduct query.

2.
Rename the query to Product.
3.
Locate the FinishedGoodsFlag column,
and then filter the column to retrieve products that are finished goods (that
is, TRUE).
4.
Remove all columns, except the following:
o ProductKey
o EnglishProductName
o StandardCost
o Color
o DimProductSubcategory
5.
Notice that the DimProductSubcategory column
represents a related table (it contains Value links).
6.
In the DimProductSubcategory column
header, at the right of the column name, click the expand button.

7.
To uncheck all columns, uncheck the (Select All Columns) item.
8.
Check the EnglishProductSubcategoryName and DimProductCategory columns.

By selecting these two columns, a transformation will be applied
to join to the DimProductSubcategory table,
and then include these columns. The DimProductCategory column
is, in fact, another related table.
9.
Uncheck the Use Original Column Name as Prefix checkbox.
Query column names must always be unique. When checked, this
checkbox would prefix each column with the expanded column name (in this
case DimProductSubcategory).
Because it's known that the selected columns don't collide with columns in
the Product query,
the option is deselected.
10.
Click OK.
11.
Expand the DimProductCategory,
and then introduce only the EnglishProductCategoryName column.
12.
Rename the following four columns:
o EnglishProductName to Product
o StandardCost to Standard Cost (include
a space)
o EnglishProductSubcategoryName to Subcategory
o EnglishProductCategoryName to Category
13.
In the status bar, verify that the query has six columns and 397
rows.
Configure
the Reseller query
In
this task, you will configure the Reseller query.
1.
Select the DimReseller query.
2.
Rename the query to Reseller.
3.
Remove all columns, except the following:
o ResellerKey
o BusinessType
o ResellerName
o DimGeography
4.
Expand the DimGeography column,
to include only the following three columns:
o City
o StateProvinceName
o EnglishCountryRegionName
5.
In the Business Type column
header, click the down-arrow, and then review the items, and the incorrect
spelling of warehouse.

6.
Right-click the Business Type column
header, and then select Replace Values.
7.
In the Replace Values window,
configure the following values:
o In
the Value to Find box,
enter Ware House
o In
the Replace With box,
enter Warehouse

8.
Click OK.
9.
Rename the following four columns:
o BusinessType to Business Type (include
a space)
o ResellerName to Reseller
o StateProvinceName to State-Province
o EnglishCountryRegionName to Country-Region
10.
In the status bar, verify that the query has 6 columns and 701
rows.
Configure
the Region query
In
this task, you will configure the Region query.
1.
Select the DimSalesTerritory query.
2.
Rename the query to Region.
3.
Apply a filter to the SalesTerritoryAlternateKey column
to remove the value 0 (zero).

4.
Remove all columns, except the following:
o SalesTerritoryKey
o SalesTerritoryRegion
o SalesTerritoryCountry
o SalesTerritoryGroup
5.
Rename the following three columns:
o SalesTerritoryRegion to Region
o SalesTerritoryCountry to Country
o SalesTerritoryGroup to Group
6.
In the status bar, verify that the query has 4 columns and 10
rows.
Configure
the Sales query
In
this task, you will configure the Sales query.
1.
Select the FactResellerSales query.
2.
Rename the query to Sales.
3.
Remove all columns, except the following:
o SalesOrderNumber
o OrderDate
o ProductKey
o ResellerKey
o EmployeeKey
o SalesTerritoryKey
o OrderQuantity
o UnitPrice
o TotalProductCost
o SalesAmount
o DimProduct
Recall in Lab 02A that
a small percentage of FactResellerSales rows
had missing TotalProductCost values.
The DimProduct column
has been included to retrieve the product standard cost, to fix the missing
values.
4.
Expand the DimProduct column,
and then include the StandardCost column.
5.
To create a custom column, on the Add Column ribbon
tab, from inside the General group,
click Custom Column.

6.
In the Custom Column window,
in the New Column Name box,
replace the text with Cost.
7.
In the Custom Column Formula box,
enter the following expression (after the equals symbol):
8.
For your convenience, you can copy the expression from the D:\DA100\Lab03A\Assets\Snippets.txt file.
Power Query
if [TotalProductCost] = null then [OrderQuantity] *
[StandardCost] else [TotalProductCost]
This expression tests if the TotalProductCost value
is missing. If it is, produce a value by multiplying the OrderQuantity value
by the StandardCost value;
otherwise, it uses the existing TotalProductCost value.
9.
Click OK.
10.
Remove the following two columns:
o TotalProductCost
o StandardCost
11.
Rename the following three columns:
o OrderQuantity to Quantity
o UnitPrice to Unit Price (include
a space)
o SalesAmount to Sales
12.
To modify the column data type, in the Quantity column
header, at the left of the column name, click the 1.2 icon, and
then select Whole Number.

Configuring the correct data type is important. When the column
contains numeric value, it's also important to choose the correct type if you
expect to perform mathematic calculations.
13.
Modify the following three-column data types to Fixed Decimal Number.
o Unit Price
o Sales
o Cost
The fixed decimal number data type stores values with full
precision, and so requires more storage space than the decimal number. It's
important to use the fixed decimal number type for financial values, or rates
(like exchange rates).
14.
In the status bar, verify that the query has 10 columns and 999+
rows.
A maximum of 1000 rows will be loaded as preview data for each
query.
Configure
the Targets query
In
this task, you'll configure the Targets query.
1.
Select the ResellerSalesTargets query.
2.
Rename the query to Targets.
3.
To unpivot the 12-month columns (M01-M12), first multi-select the Year and EmployeeID column
headers.

4. Right-click either of the select column headers, and then in the context menu, select Unpivot Other Columns.
5.
Notice that the column names now appear in the Attribute column,
and the values appear in the Value column.
6.
Apply a filter to the Value column to remove hyphen (-)
values.
7.
Rename the following two columns:
o Attribute to MonthNumber (no
space between the two words it will be removed later)
o Value to Target
You'll now apply transformations to produce a date column. The
date will be derived from the Year and MonthNumber columns.
You'll create the column by using the Columns From Examples feature.
8.
To prepare the MonthNumber column
values, right-click the MonthNumber column
header, and then select Replace Values.
9.
In the Replace Values window,
in the Value To Find box,
enter M.
10.
Click OK.
11.
Modify the MonthNumber column
data type to Whole Number.

12.
On the Add Column ribbon
tab, from inside the General group,
click The Column From Examples icon.

13.
Notice that the first row is for year 2017 and month
number 7.
14.
In the Column1 column,
in the first grid cell, enter 7/1/2017,
and then press Enter.
The virtual machine uses US regional settings, so this date is
in fact July 1, 2017.
15.
Notice that the grid cells update with predicted values.
The feature has accurately predicted that you're combining
values from two columns.
16.
Notice also the formula presented above the query grid.

17.
To rename the new column, double-click the Merged column
header.
18.
Rename the column as TargetMonth.
19.
Click OK.
20.
Remove the following columns:
o Year
o MonthNumber
21.
Modify the following column data types:
o Target as
fixed decimal number
o TargetMonth as
date
22.
To multiply the Target values
by 1000, select the Target column
header, and then on the Transform ribbon
tab, from inside the Number Column group,
click Standard,
and then select Multiply.

23.
In the Multiply window,
in the Value box,
enter 1000.
24.
Click OK.
25.
In the status bar, verify that the query has 3 columns and 809
rows.
Configure
the ColorFormats query
In
this task, you'll configure the ColorFormats query.
1.
Select the ColorFormats query.
2.
Notice that the first row contains the column names.
3.
On the Home ribbon
tab, from inside the Transform group,
click Use First Row as Headers.

4.
In the status bar, verify that the query has 3 columns and 10
rows.
Update
the Product query
In
this task, you'll update the Product query
by merging the ColorFormats query.
1.
Select the Product query.
2.
To merge the ColorFormats query,
on the Home ribbon
tab, from inside the Combine group,
click Merge Queries.

Merging queries allows integrating data, in this case from
different data sources (SQL Server and a CSV file).
3.
In the Merge window,
in the Product query
grid, select the Color column
header.

4. Beneath the Product query grid, in the dropdown list, select the ColorFormats query.
5.
In the ColorFormats query
grid, select the Color column
header.
6.
When the Privacy Levels window
opens, for each of the two data sources, in the corresponding dropdown list,
select Organizational.

Privacy levels can be configured for data source to determine
whether data can be shared between sources. Setting each data source as Organizational allows
them to share data, if necessary. Private data sources can never be shared with
other data sources. It doesn't mean that Private data cannot be shared; it
means that the Power Query engine cannot share data between the sources.
7.
Click Save.
8.
In the Merge window,
click OK.
9.
Expand the ColorFormats column
to include the following two columns:
o Background
Color Format
o Font
Color Format
10.
In the status bar, verify that the query now has 8 columns and
397 rows.
Update
the ColorFormats query
In
this task, you'll update the ColorFormats to
disable its load.
1.
Select the ColorFormats query.
2.
In the Query Settings pane,
click the All Properties link.

3.
In the Query Properties window,
uncheck the Enable Load To Report checkbox.
Disabling the load means it won't load as a table to the data
model. This is done because the query was merged with the Product query, which
is enabled to load to the data model.
4.
Click OK.
Finish
up
In
this task, you'll complete the lab.
1.
Verify that you have eight queries, correctly named as follows:
o Salesperson
o SalespersonRegion
o Product
o Reseller
o Region
o Sales
o Targets
o ColorFormats
(which won't load to the data model)
2.
To load the data model, on the File backstage
view, select Close & Apply.
All load-enabled queries are now loaded to the data model.
3.
In the Fields pane
(located at the right), notice the seven tables loaded to the data model.

4.
Save the Power BI Desktop file.
5.
Leave Power BI Desktop open.
In
the next lab, you'll configure data model tables and relationships.
Ending
Your Lab
To
end this lab, select the Done button
in the bottom right corner of this instruction window.


0 Comments